

Increased Risk of Reinfection with Omicron? A Comprehensive Appraisal of the S. Africa Study
Evolution of testing standards and key methodological assumptions challenge the conclusion of higher reinfection risk with Omicron.

The anticipated threat of the Omicron variant has taken the world by storm, with numerous anecdotes and descriptions initially gaining traction. One of the early narratives was that Omicron may cause a “rise in reinfections”, as described anecdotally in this WSJ article. Now, a pre-print (Pulliam, et al.) has been posted that describes the basis of this narrative. The implications of this study are profound enough that it is worth critically appraising, which I will do here.
First, I would like to commend the authors, on producing such a heavy lift of work in such a small period of time. They repurposed an earlier study published on November 11th, to specifically address the onset of Omicron. Literally, only after days of the data being reported, the authors posted the new manuscript, which takes an incredible amount of dedication and hard work. And, I am genuinely appreciative of the effort on a very important topic.
Secondly, the criticisms I provide here are similar to the context of “peer-review’, identifying concerns and asking critical questions that may confirm (or refute) the validity of the study. “Peer-review” happens all the time, with the spirit of collegiality, and behind the scenes. The goal is not to “shoot down” the study, but to provide the authors with feedback that may strengthen the claims. Critiquing validity is crucial to the scientific process.
Thirdly, I apologize in advance for highly technical perspective of this article. I have tried my best to distill it into common language, but as with these type of reviews, there will always be discussion of technical detail. Feel free to scroll to the conclusions for the “nutshell” analysis.
Finally, I have personally reached out to the authors of these studies regarding these queries, and will update this article accordingly if I get a response. These are queries, in which the authors may have a reasonable rebuttal - and I am open to hearing them out. In real peer-review, authors are given a chance to rebut the concerns, and if the reviewers deem acceptable, the study is accepted for publication. Peer review is a fluid, bilateral process.
Summary of Manuscript
For context, the study utilizes a South African national database that contains nearly 3 million known SARS-CoV-2 infections, spanning March 2020 - November 2021 . The study then identifies “re-infections” prior to November 27th, defined as a positive test 90 days after a prior positive test. Overall, there were 35,670 suspected reinfections since the beginning of the pandemic - but the authors hypothesize that the rates of reinfection are higher during the Omicron phase, compared to prior waves. The authors present some complex methods, via two approaches: [1] a “null model” approach, and [2] estimating time-varying hazard ratios (similar to risk ratios) of reinfection compared to baseline during “wave 1” (June-August of 2020).
For “Approach 1”, the author’s essentially create a model that “fits” to the the first three waves, and then applies it to the reinfections of the current fourth wave. Since the rate of reinfection beats the “null model”, the authors claim it is consistent with “immune escape.” I will not focus too much on this approach, because it utilizes modeling techniques, and can be generically and effectively refuted by understanding that future results cannot be predicted from past events. Models are only as good as the assumptions, which can change.
For “Approach 2”, the authors report that while the hazard (e.g. “risk”) ratio for reinfection were lower during “wave 2” (“Beta”, 0.75) and “wave 3” (“Delta”, 0.71) when compared to “wave 1”, the ratio is now 2.39 at the onset of Omicron. So, they conclude that while prior infection was protective for Beta and Delta variants, this level of protection may be reduced versus Omicron. We will focus most of our critique on this approach.
Interestingly, this is a second draft posted by the authors. The first draft truncated the data after late June (during the up rise of Delta), and initially and strongly concluded that reinfection rates were extremely low, and there was no evidence of “immune escape”. The second draft includes the more complete data from the Delta phase, and the administrative addition of rapid antigen testing, which was previously excluded from the database- leading to the newer conclusion of immune escape with the Omicron variant . The addition of rapid antigen testing needs to be critically queried, as we will do below.
Though the study does not look at the rate of breakthrough infection with vaccination, the authors astutely point out that:
“Urgent questions remain regarding whether Omicron is also able to evade vaccine-induced immunity and the potential implications of reduced immunity to infection on protection against severe disease and death.”
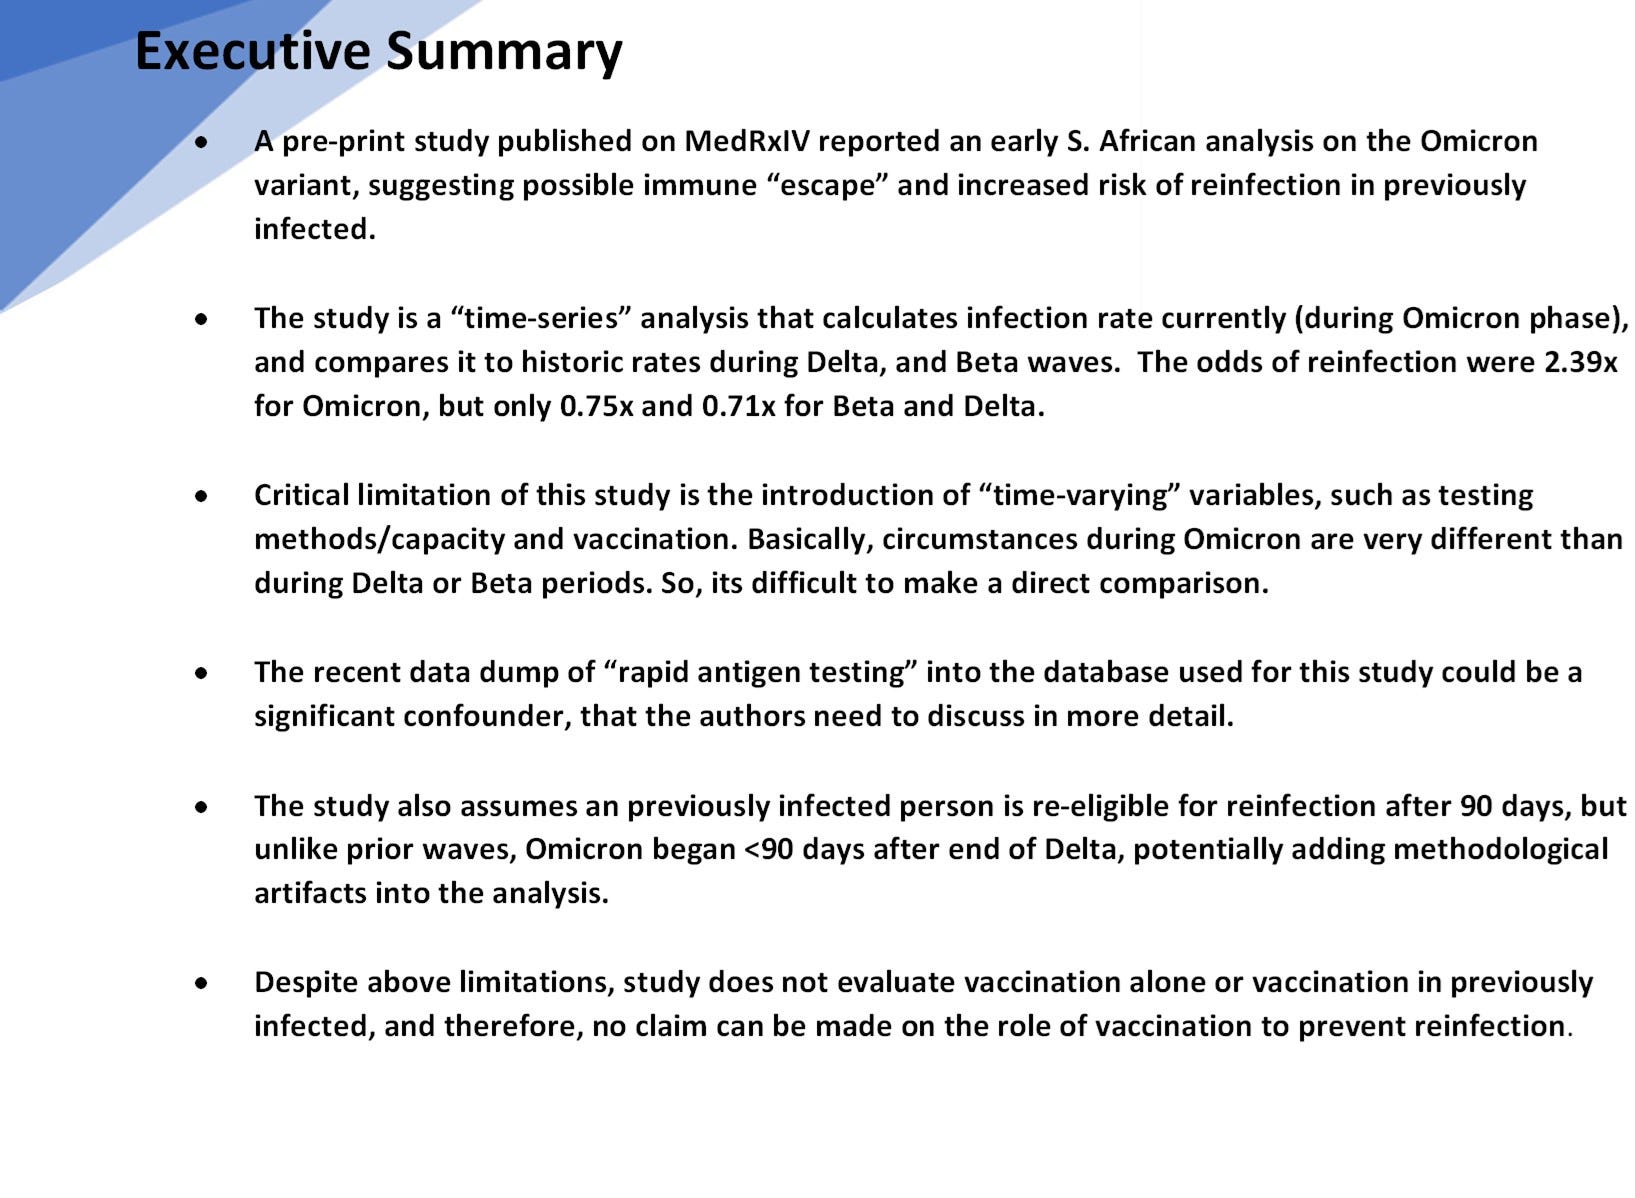
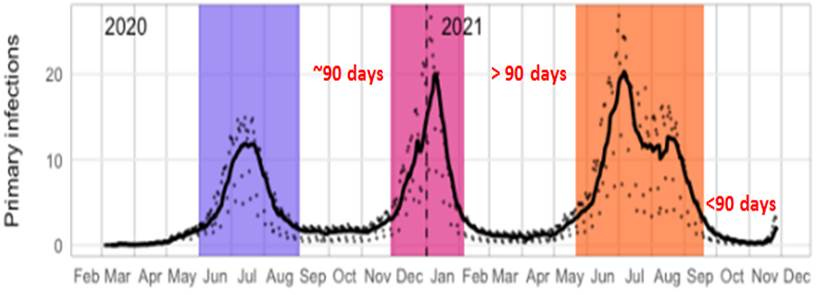
Certainly, if a virus can evade polyclonal natural immunity, one would have to be at least concerned that it would evade oligoclonal vaccinated immunity. In contrast to what we see with Beta and Delta, the authors suggest data from the short period starting November implies higher reinfection. Its important to recognize the perspective of the very short period they are analyzing related to the length of the entire pandemic:
Critical Overview
In essence, the authors are trying to find a “signal” of increased reinfection within the last three weeks, compared with the prior 90 weeks of the pandemic (figure, above). This is difficult, because there are many variables and noisy artifacts that change with time (time-varying confounders), that make the infection rate today difficult to compare with the infection rates of prior waves. Two very important time-varying confounders here are [1] the introduction of vaccinations in South Africa that began in early June 2021 (which are tangentially discussed, though a crude sensitivity analysis), and [2] evolving testing methods — specifically the introduction of antigen testing (in addition to PCR), which was retroactively added to S. Africa’s database on 11/23. These dynamics, in addition to the short observation period, may make it difficult to establish any firm conclusion early in Wave 4, due to noise and time-varying variables.
Because many will (have) run with the “narrative”, it is important to also understand what the study DOES NOT evaluate or account for:
The study does not evaluate the rate of vaccination breakthrough infection in naive persons, as a comparison to the protection afforded by prior infection.
The study does not evaluate the efficacy of vaccination in the previously infected (or anyone), for any variant (including Omicron).
The study directly does not account for serological status (antibody presence), a stronger indicator of immunity, as a predictor of protection from reinfection. As such, the pool of the previously infected may include weakly immune or non-immune persons.
The study does not evaluate severity of reinfection (hospitalization or death), in the context of many initial accounts that suggest Omicron may be much milder than previous variants. This may also dilute the previously infected pool with persons aymptomatically colonized with SARS-CoV-2, but not necessarily infected to elicit an immune response.
The study does not confirm that positive reinfections are actually due to Omicron, but assumes that infections after November 1st are likely due to it. This is a crucial, but tenuous assumption.
And, some other basic notable observations:
Through 2020 and prior to October 2021, the hazard for reinfection versus primary infections, has remained low, between 0.1 and 0.2 (~80-90% risk reduction by previous infection).
Even in this most recent phase, if we accept the authors’ observation that reinfections are rising, it is still significantly less than the hazard for primary infection, despite vaccinations.
Criticism 1: Evolving Testing Capacity and Introduction of Antigen Testing
Generally, RT-PCR is the gold-standard by which reinfection is defined. While there are some disadvantages to its use — namely sensitivity to “cycle times” and detection of persistent (but dead) viral DNA, RT-PCR has been the historical basis for diagnosis More recently, “antigen” testing has been used, which allows for more rapid results. As the pandemic as gone on, more countries are utilizing antigen tests for quick symptomatic screening (e.g. at Urgent Care centers in the U.S.) or asymptomatic screening. As such, many more people have access to antigen testing today, compared to earlier time points in the pandemic.
In Version 2 of this study, the authors utilize a South African national database as its source (the National Institute for Communicable Disease), and note in the methods:
“All positive tests conducted in South Africa appear in the combined data set, regardless of the reason for testing or type of test (PCR or antigen detection), and include the large number of positive tests that were retrospectively added to the data set on 23 November 2021 (11).
So, the South African government decided to populate its COVID database with roughly 75,000 previously performed antigen tests, with nearly 21,000 positives. In and by itself, this would not be an issue if antigen testing is interchangeable with RT-PCR - but its not. Antigen tests are used precisely because they are rapid and cheaper — and allow for greater frequency of testing, including testing asymptomatic persons (for screening purposes). If you test more in a population for the same disease, you will pick-up more disease.
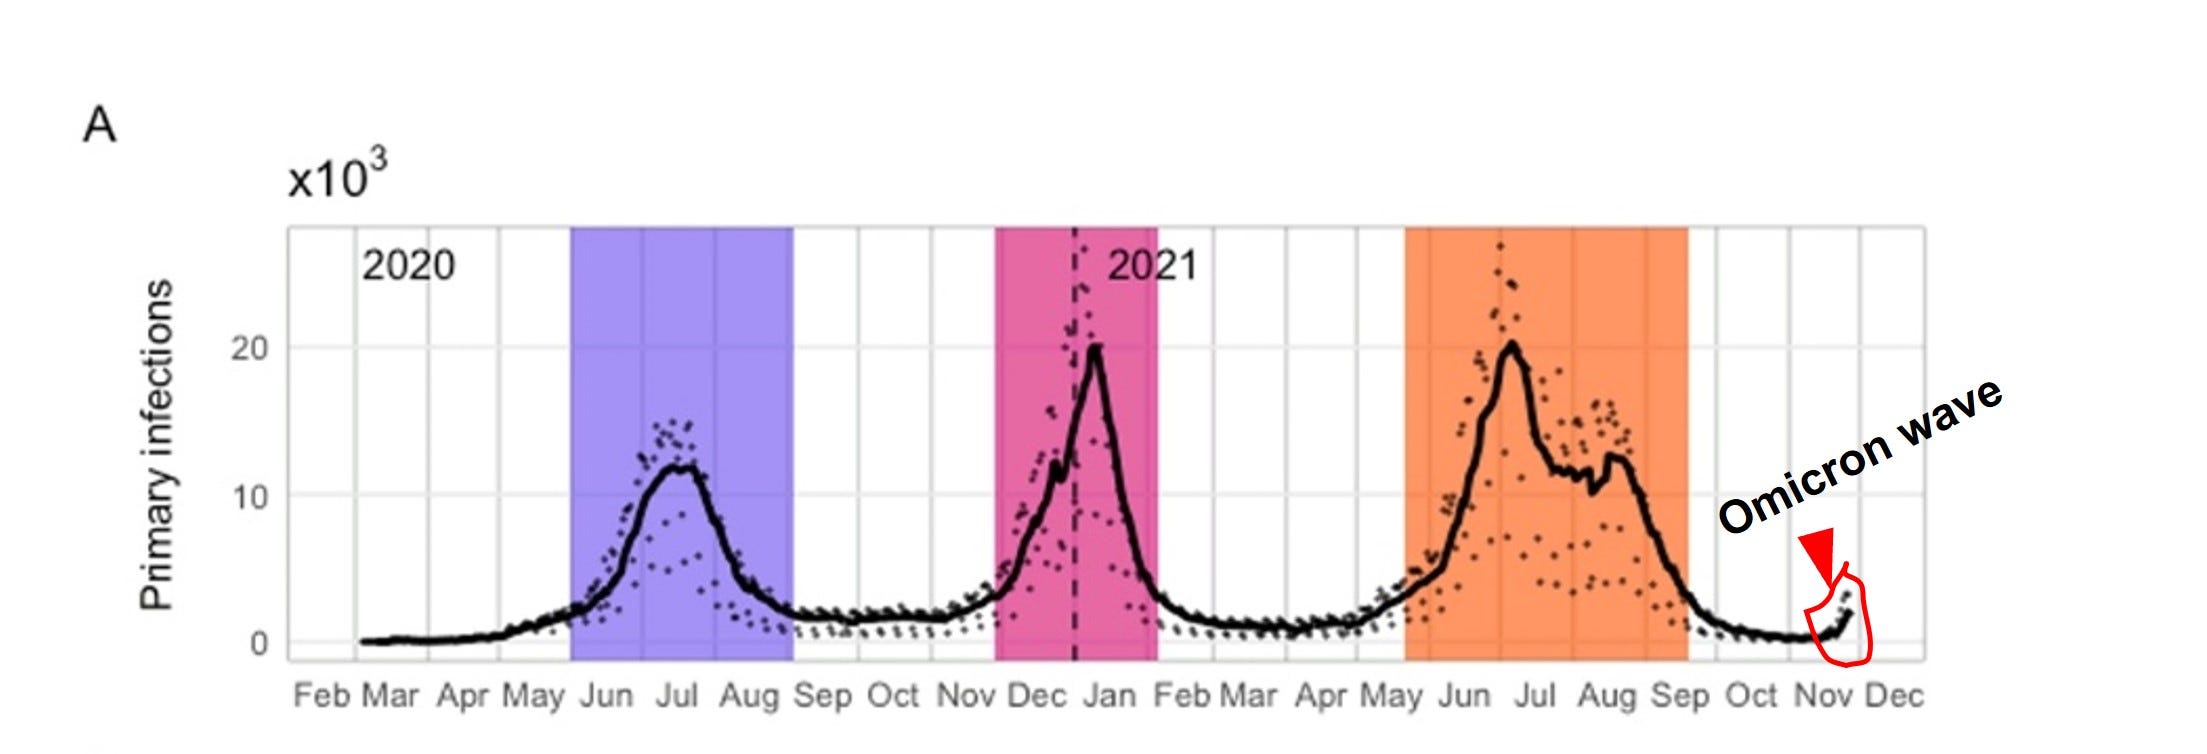
The author’s state that antigen testing introduced in late 2020 (pg. 23, MedRxIV), but give no accounting for the time course of its use. This report, suggests that antigen testing in S. Africa is a more recent capability, beginning in earnest in the Summer of 2021. And if you compare (and overlay) Version 1 vs Version 2 of the authors’ draft (Figures 1A and 1C), one notes that there is virtually no difference in either primary infection or in reinfection prior to July, despite an addition of 21,000 positive tests:
Therefore, it would reason that these rapid antigen positives occur mostly after July. There may also be some concern on the accuracy and dating of these antigen tests (“underreporting”, “late reporting” etc.) . If these concerns are true, the testing circumstances during the upstart of Omicron is significantly different, and the increased rates of reinfection cannot be compared to prior reinfection rates.
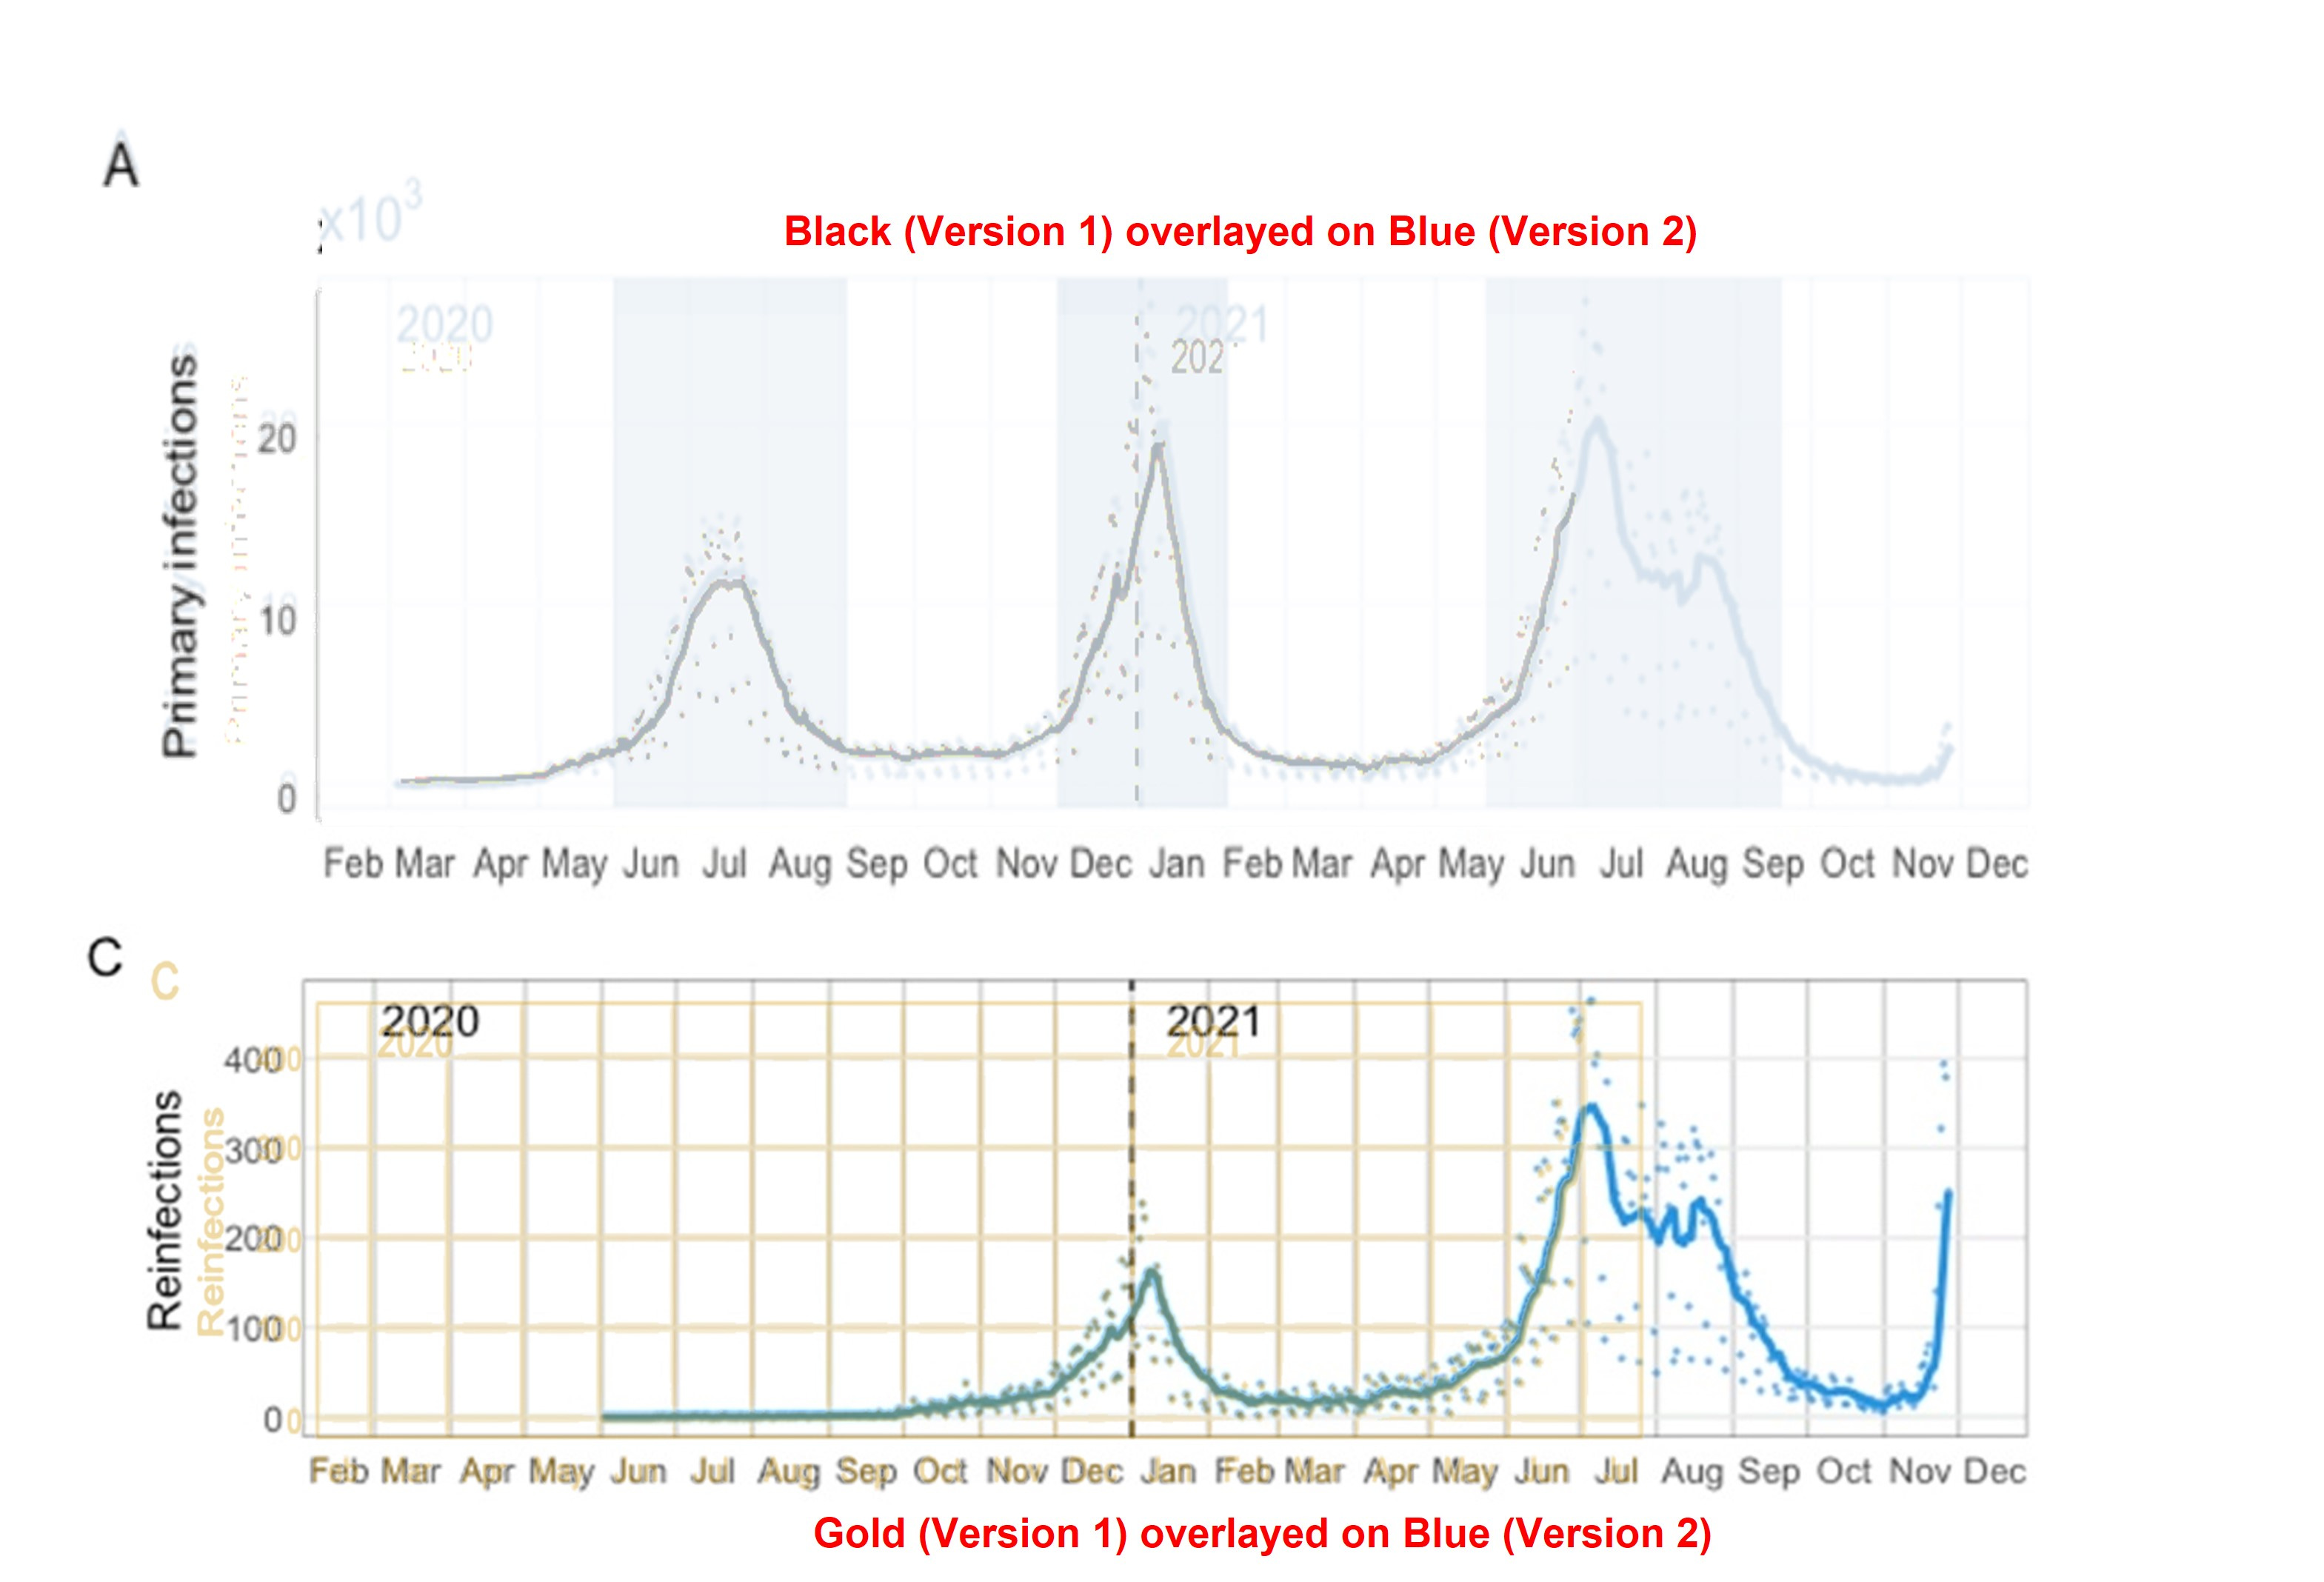
In fact, if you pull the testing data and look at daily tests in South Africa from the beginning of the pandemic, you will find a general increase in the number of tests conducted over time — and testing capacity and method during Omicron is substantively different than in earlier phases of the pandemic.
How, then, can we fairly compare the Omicron reinfection odds ratio (2.39) to odds ratios previously observed during the pandemic? In their limitations, the authors do address the introduction of antigen testing into the analysis:
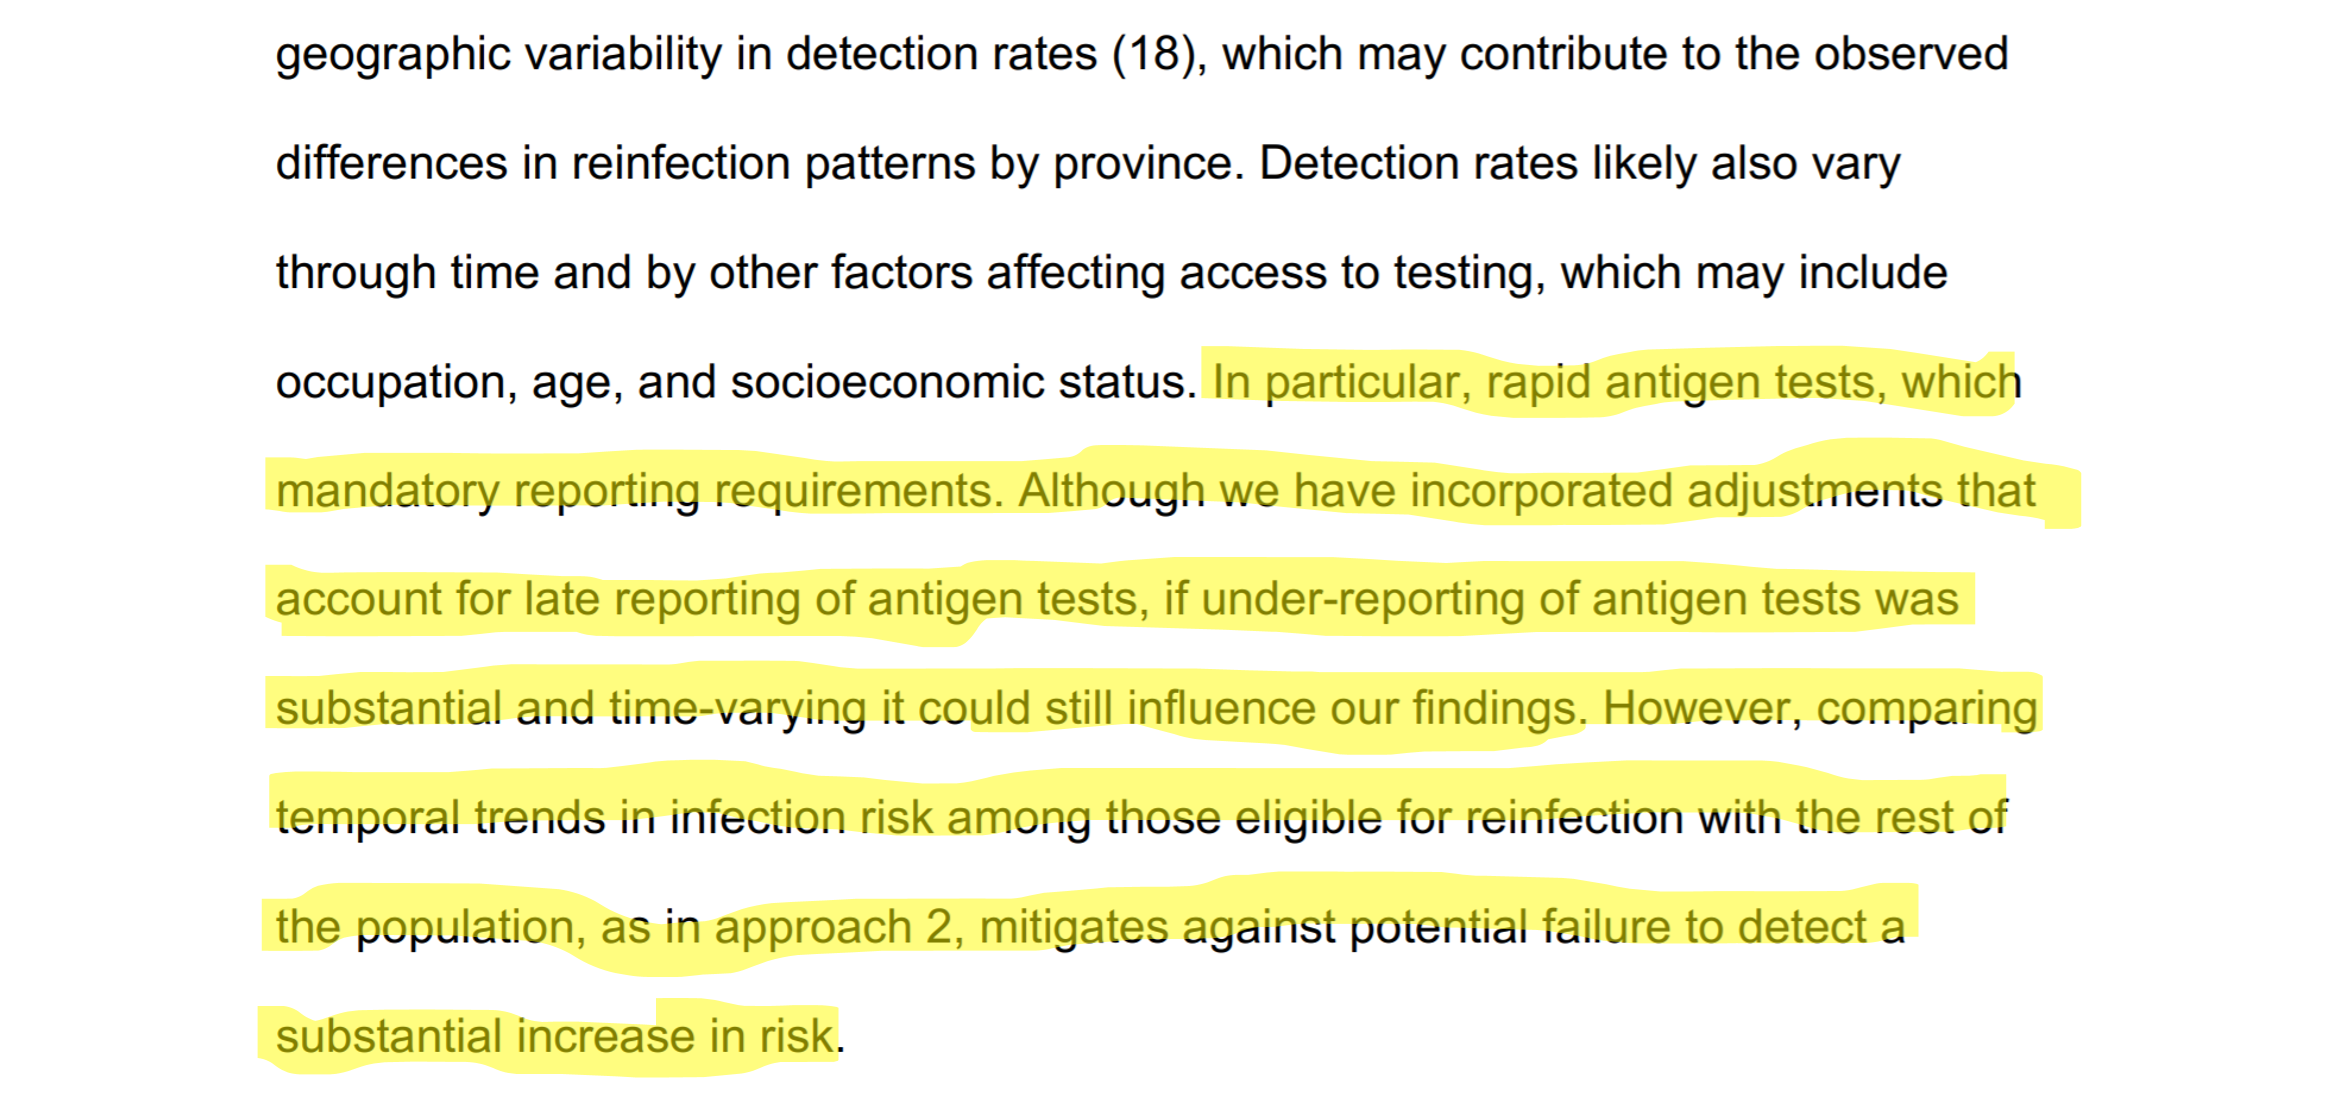
The authors try to statistically “adjust” for the rapid antigen testing, but also acknowledge that “late reporting” and “under-reporting” could influence the results. Because the authors do not provide any data on the relative volume or temporal trends of antigen reporting, it is difficult to assess validity of the correction, yet this could be a critical confounder of the results. The authors mitigate this concern by comparing the temporal trends of reinfection to infection in the naive population (we will discuss that analysis in the next section).
Note, that this may not be a trivial point. While in Version 1, the authors analyzed ~15,000 reinfections, from July onward (Version 2), they report a total of nearly ~36,000 reinfections, roughly double the reinfection volume. And, total positives due to rapid infection tests were nearly 21,000 according to the South African government— which, if concentrated after July, could make up a significant proportion of the additional reinfections during Delta and Omicron.
If I were a peer-reviewer for this manuscript, I would ask the author’s to provide more specifics on the time-variance of rapid antigen testing— specifically, how it was on-ramped, and the relative proportions of reinfections that were detected by antigen testing versus RT-PCR. More detail on statistical adjustments should be given as well. I would also ask the authors to reconcile the two version — why does the addition of ~21,000 positive tests not change any of the data trends prior to July 2021? There may be a reasonable explanation, but it needs to be explicitly stated.
Criticism 2: Hazard Analysis Methodology and 90-day “Grace Period”
In order to mitigate the fact that recent incorporation of antigen testing (and other time-varying confounders) could influence the results, the authors provide a hazard analysis on reinfection and primary infection (the population of people infected without history of a prior infection). The reasoning is that if both populations were subject to the same time-varying dynamics, then both populations would experience similar bias.
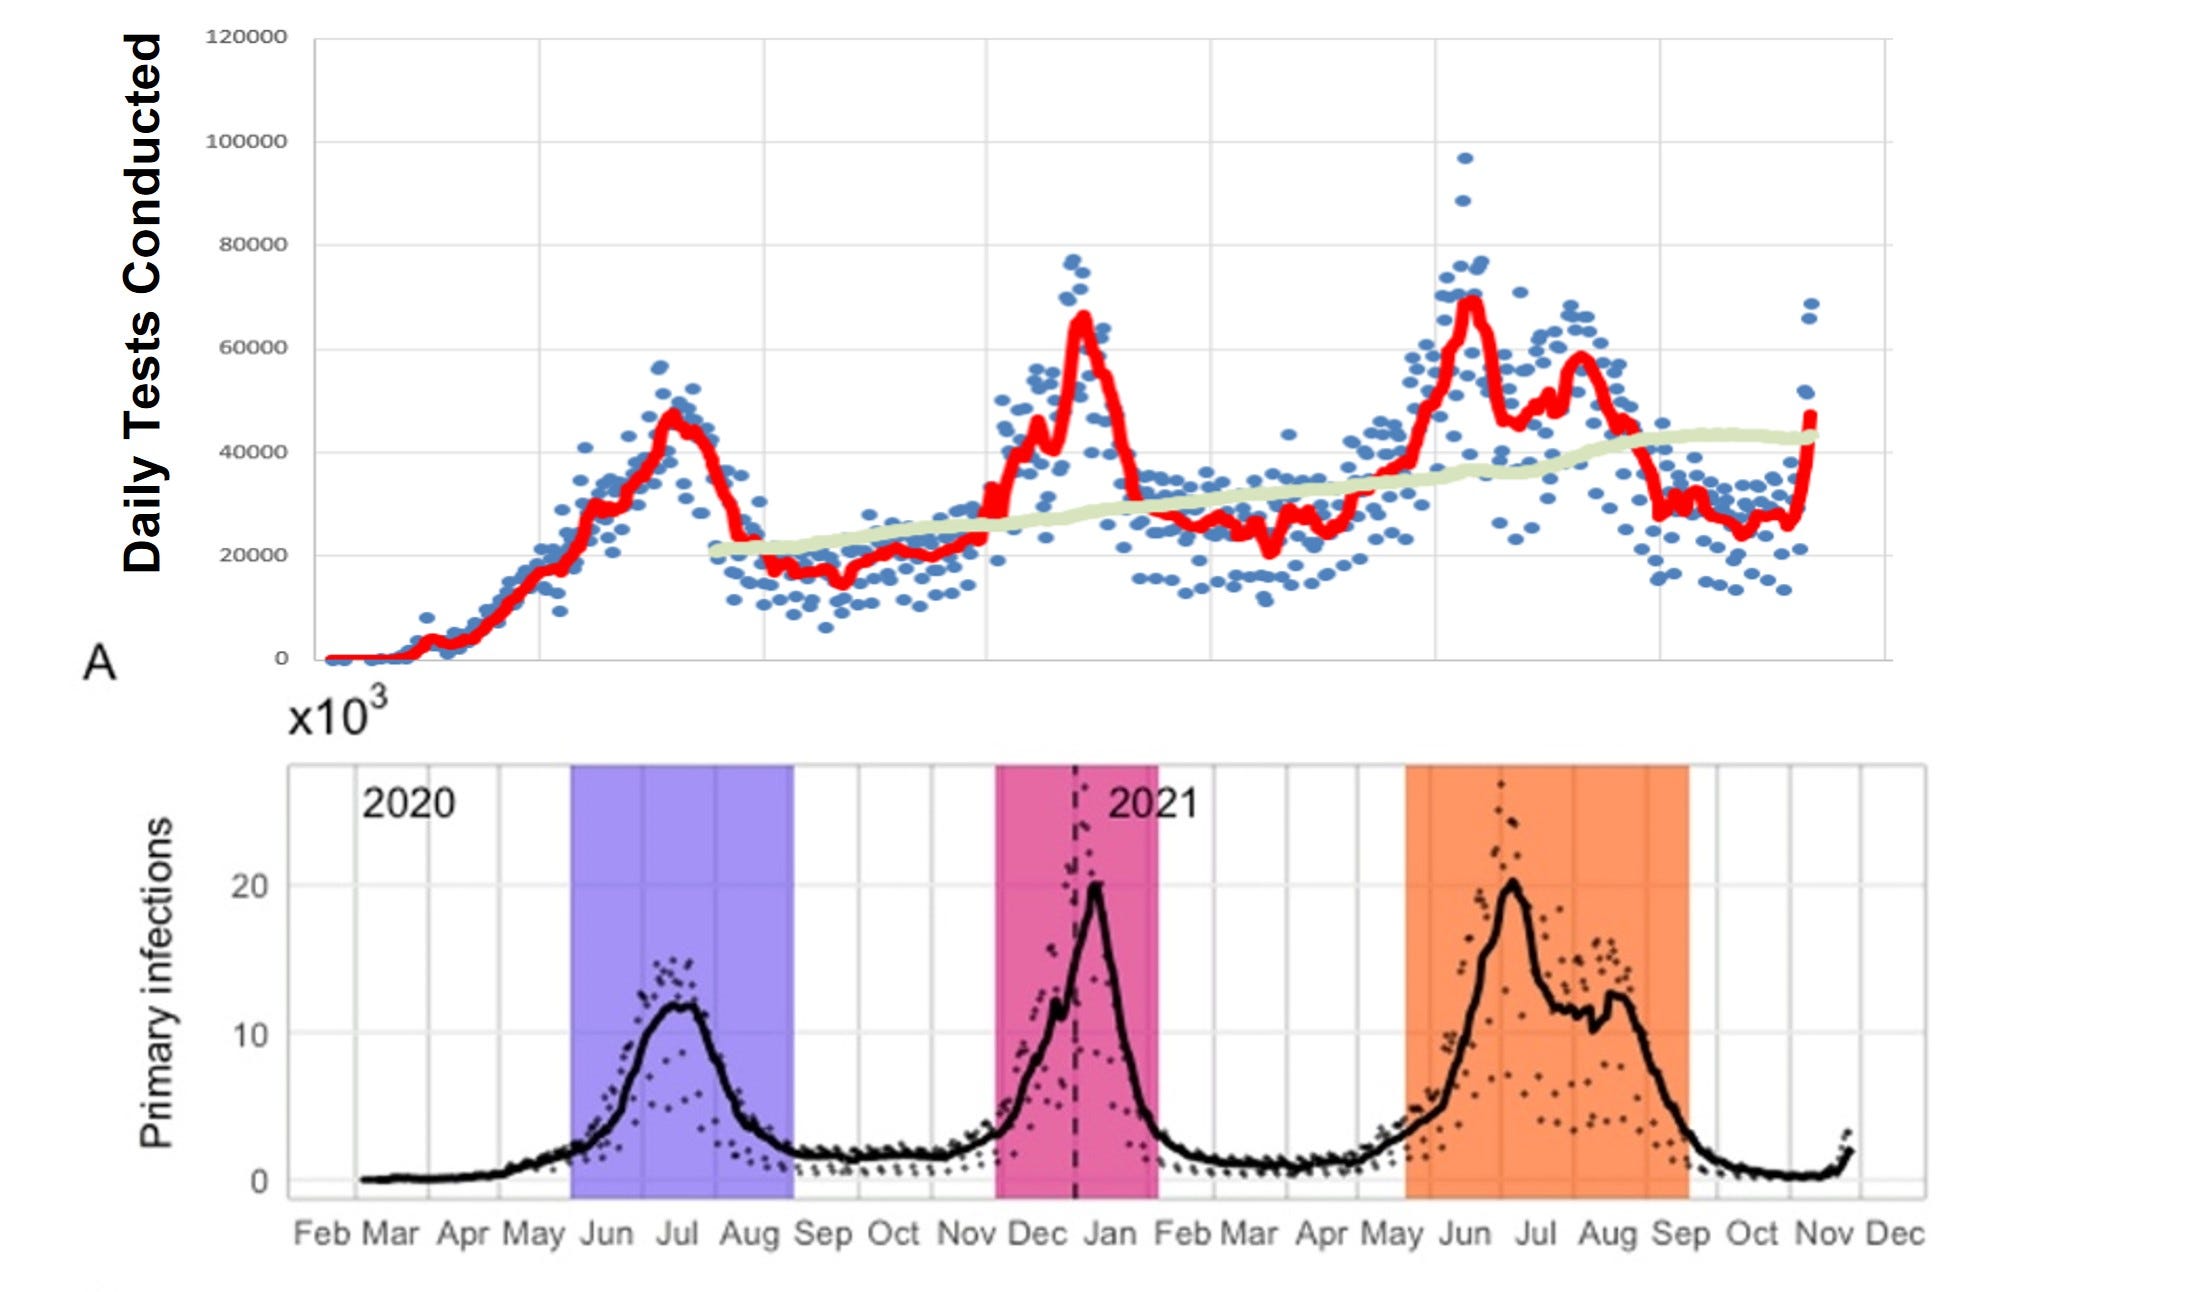
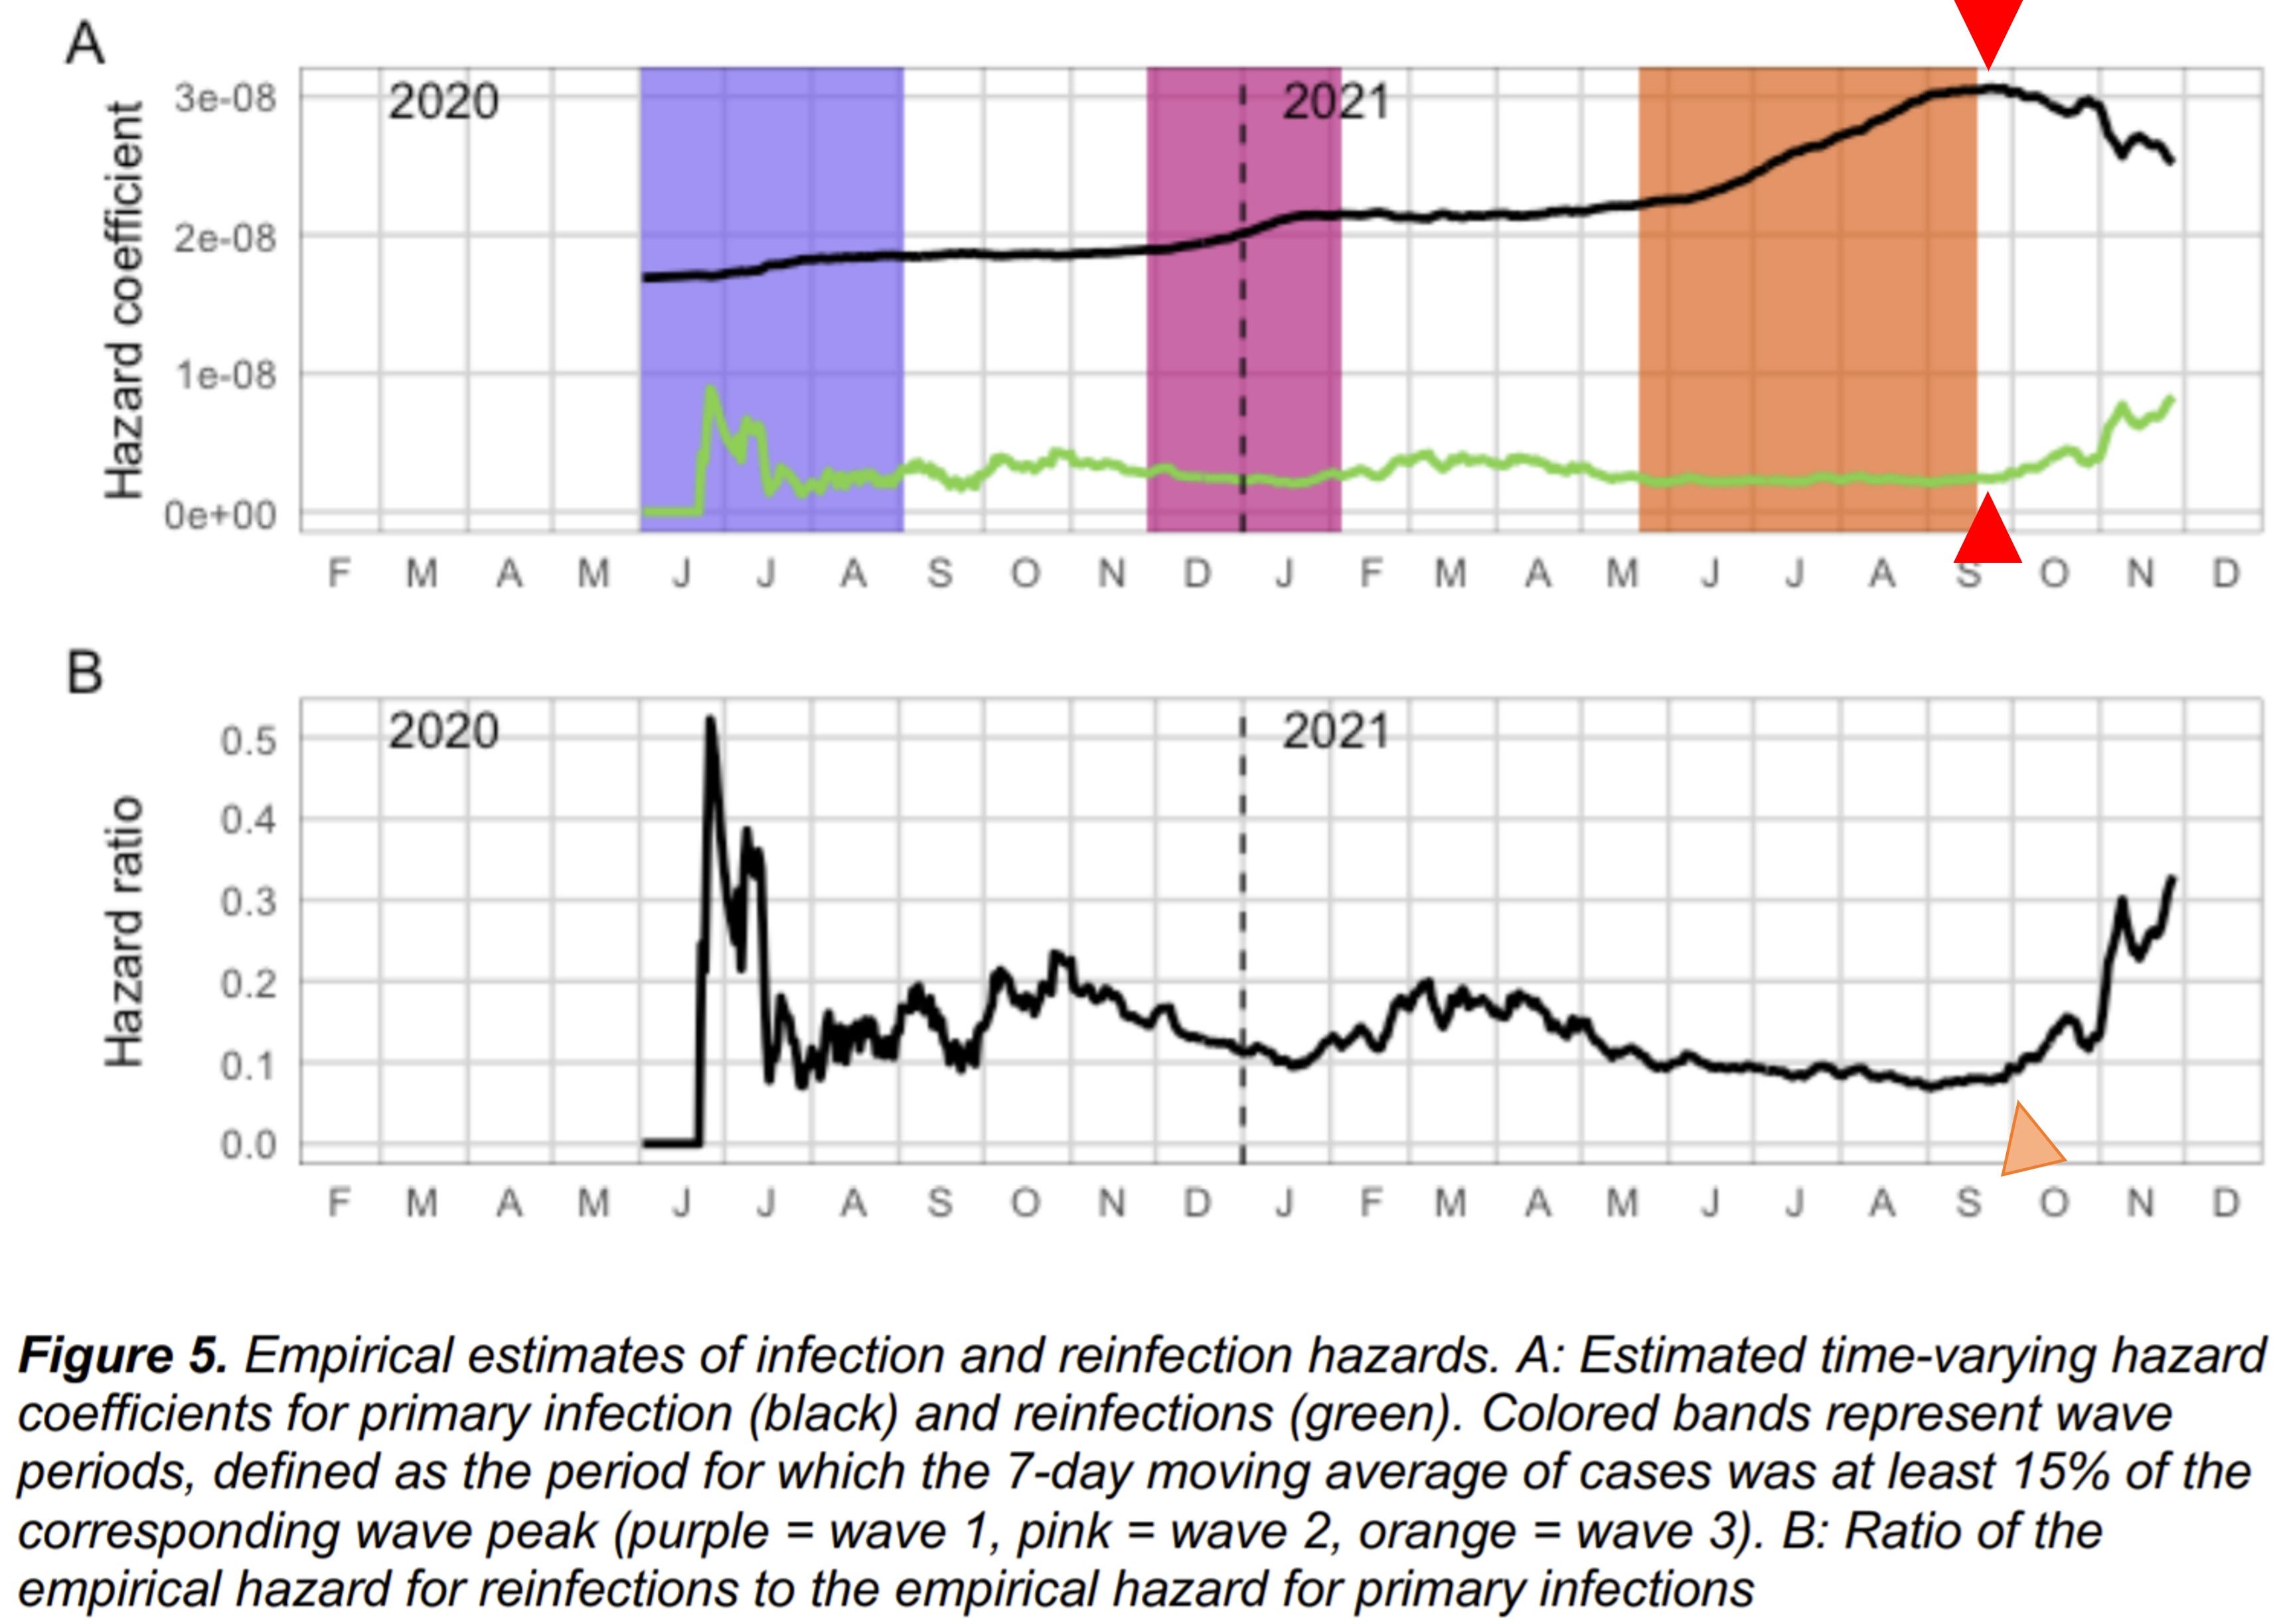
The authors note starting late August, that the hazard coefficient (a proxy for “risk”) of primary infection begins to decline, while rate of reinfection begins to increase (red arrows, below). This “inverse correlation” is a new phenomena, and not seen previously in the pandemic. And, in fact, if you take the ratio of reinfection hazard to primary infection hazard, one sees an ominous increase (orange arrow) . As such, the authors have more confidence in the conclusion that reinfection rates with Omicron are increasing.
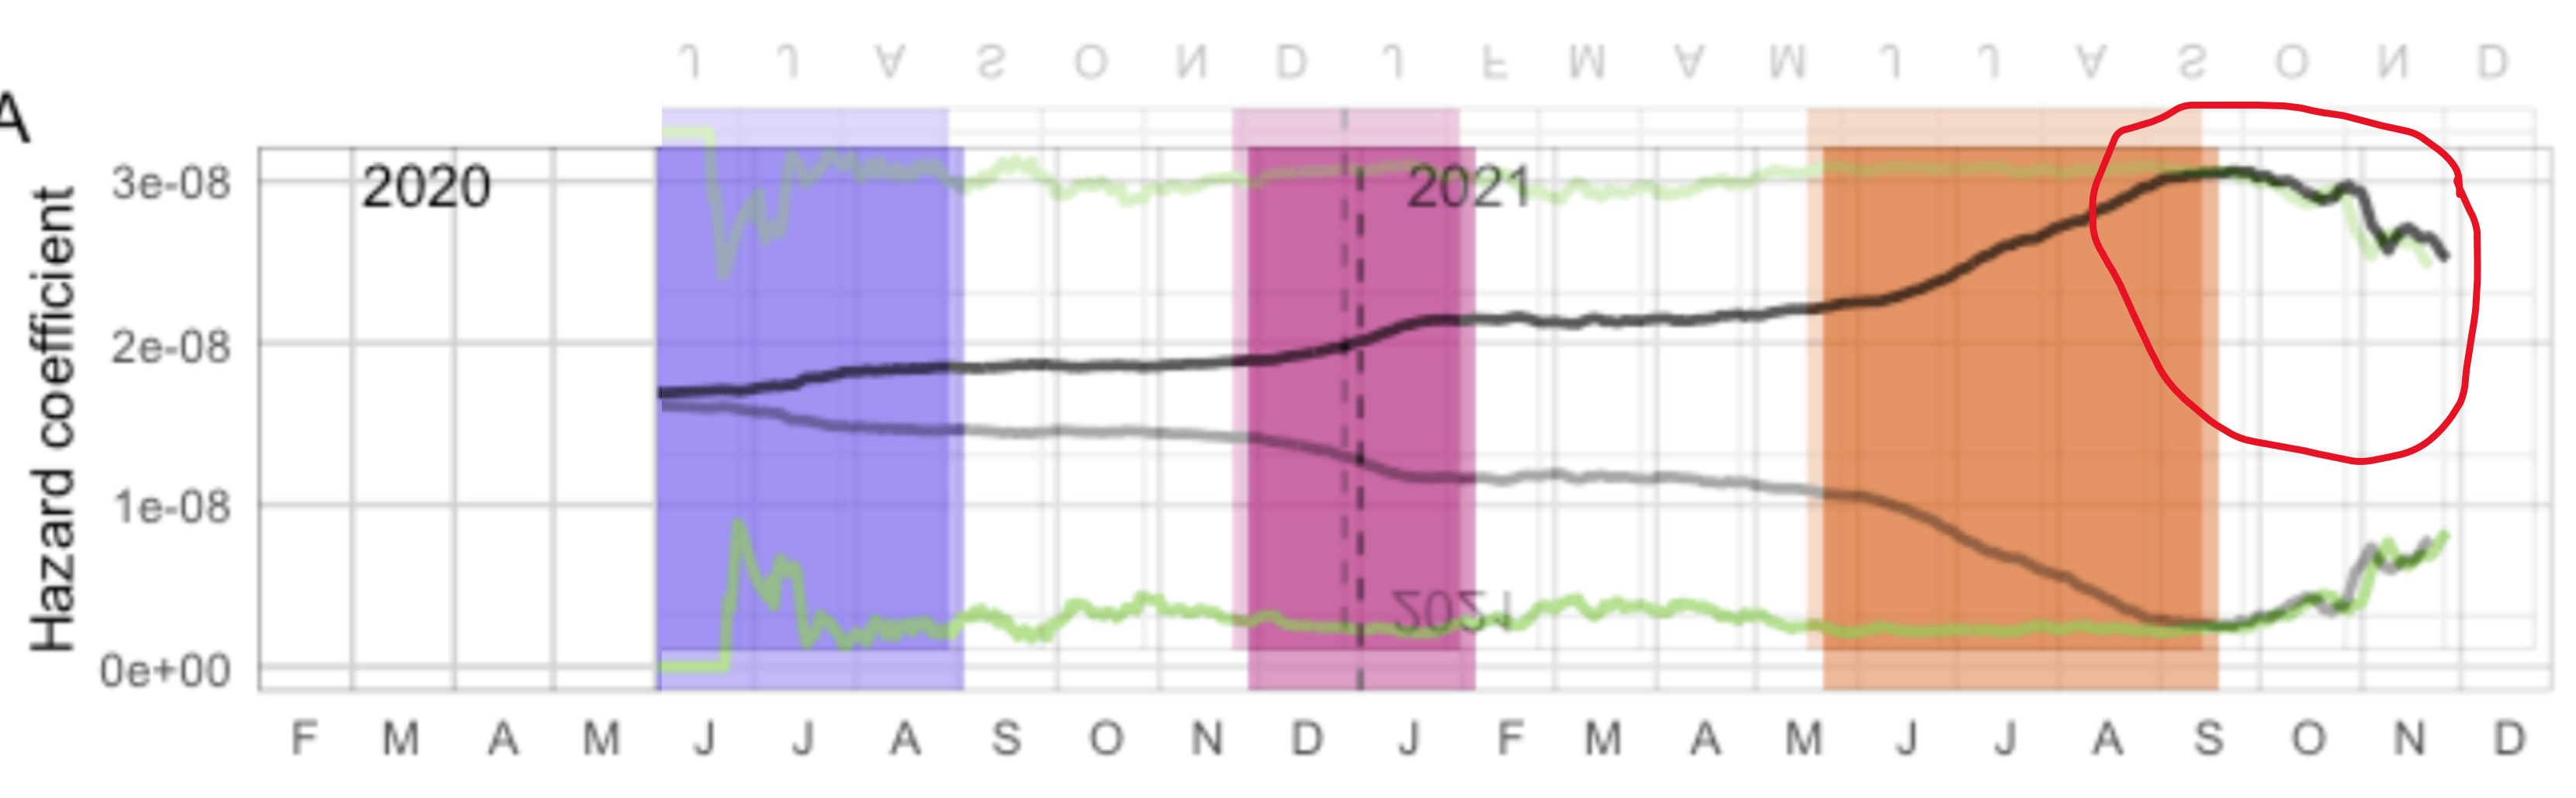
However, these graphs raise several questions. First, why does the trend “inversion” begin in early September (red dotted line, below), when the steep rise in of Wave 4 (presumably Omicron), begins in November (red encircled, below), a full two months later? Are the authors suggesting, that infections began to only infect the previously infected, while avoiding the naive population, beginning early in September? The authors do imply that the rise of vaccinations could lead to a downturn in primary infection. But in a crude sensitivity analysis that excludes the maximal impact of vaccination, the primary infection hazard rate still does not increase as it does with reinfection (Supplementary Appendix, Figure S9). Thus, the fact that the same viral “force” does not cause correlative increases in both populations, suggests some methodological flaw — unless the virus specifically targets the previously infected (unlikely). (N.B. “Correlation” means the signals move together, “inverse correlation” means they move in opposite directions.)
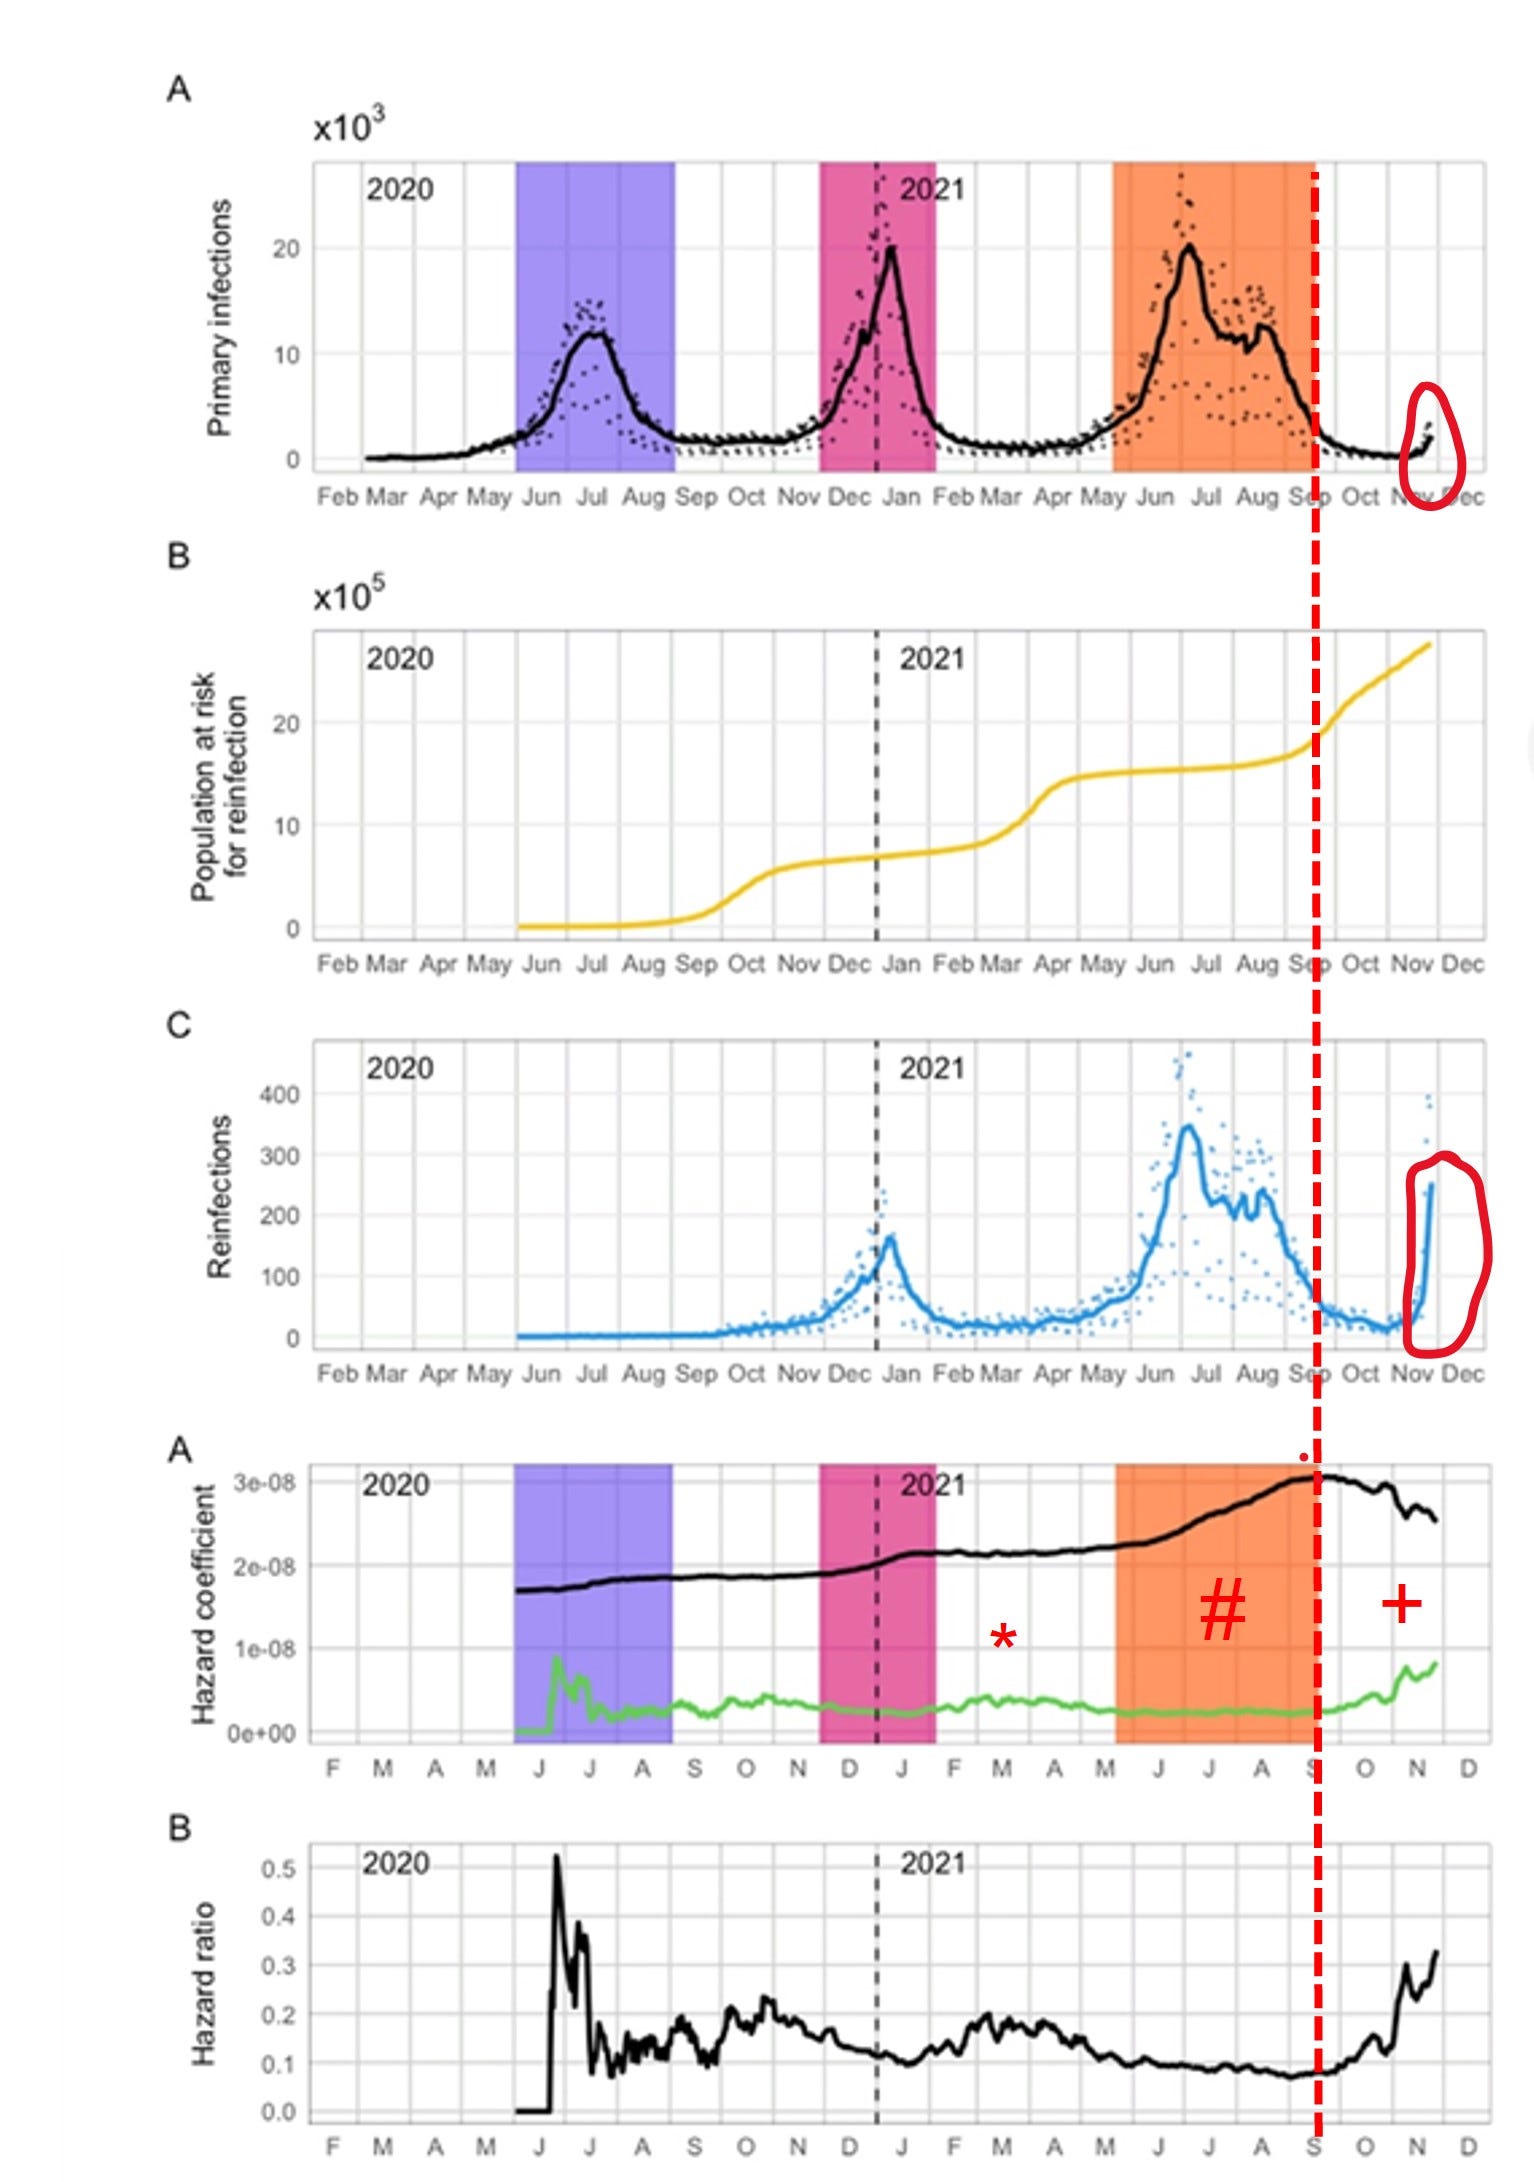
Also, note that the hazard coefficients for primary infection (black, 2nd graph from below) and reinfection (green) were never strongly correlated prior to September. In early 2021 (*), there was slight rise in the reinfection hazard, without any similar rise in primary infection. During the Delta phase (#), there was steep rise in primary infection, but a flat rate of reinfection. But, beginning early September, there is an EXACT INVERSE CORRELATION between reinfection and primary infection. And in fact, the correlation is so precise, that the “notching” phenomena we see at (+) is a PRECISE INVERSE MATCH:
In other words, the decline in primary infection hazard exactly mimics the rise in reinfection — which does not make practical sense. As we have seen from current data in December (subsequent to this study), Omicron appears to be highly infectious and likely impacts the naive, and even vaccinated populations. So, the findings after a complex mathematical method, does not match intuitive reality. So, why would a decrease in primary infections come at an exact cost of reinfection?

In fact, the correlation of the hazard coefficients seem to echo the morphology of the overall daily infections from 90 days prior during Delta. In the graph above, authors’ Figure 1 (Daily Infections) is superimposed on Figure 5A to match the time axis. The notching phenomena almost “echoes” similar notching from 90 days prior, and the overall rise in reinfection signal (end of August) correlates with the beginning of the rise of delta 90 days prior. What is so special about 90 days? It happens to be the authors’ defined “grace time” for eligibility for reinfection after a prior infection. Individuals who are infected during the Delta wave, are removed from the primary population, and placed into the previously infected population eligible for reinfection, but only after 90 days (this is done to avoid the conflation of persistent infection with reinfection).
But, while this time period worked for prior waves (Waves 1, 2 and 3) because each was separated by > 90 days, this new Omicron wave has begun prior to 90 days after the end of the Delta wave. Therefore, the calculation of hazard rates in early November implicitly involve the volatile period of 90 days prior, in the mid-Delta phase. My concern is that the methodology is picking up artifactual effects that are echoing the volatility of the recent Delta phase.
The issue is difficult to diagnose, without the presentation of the granular data manipulations at each step, but the authors do give a general mathematical description of the methodology. In general, as primary infections begin to accumulate the population eligible for reinfection increases as well in a delayed fashion (and the rate decreases, because the denominator increases). However, it is a bit more complicated, because in this study, the authors model suspected undiagnosed reinfections (based on an arbitrary probability that a reinfection goes undiagnosed, 50% in this case), and remove them from the eligible population as well:
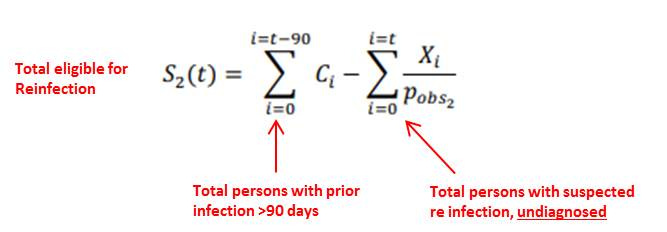
This mathematical equation states, on any given day t, that the total re-eligible for S2(t), is the sum of all infections up until 90 days prior, minus all reinfections (x 2) up until the given day t. In other words, recent reinfections (within 90 days) will reduce the denominator, while it takes 90 days for a previously infected person to be eligible to increase the denominator. This “lag” phenomena may explain why the reinfection hazard rate increases exactly at the tail end of the Delta— the recent wave of reinfections are being immediately removed from the eligible population, while the newly infected take 90 days to be eligible. This also explains the “echoing” effect that we see 90 days later. (And, because this S2 term is implicitly used to calculate the primary hazard ratio, we see the counterintuitive “inverse” correlation).
(N.B. Also note that in between prior waves (Waves 1-2, Waves 2-3) there was a slight bump in the reinfection hazard (and ratio compared to primary infection), lasting about 90 days. The bump is probably more exaggerated with Wave 4 due to its close proximity to Delta.)
Therefore, because the new Omicron wave is happening within 90 days of the completion of Delta (unlike the other waves), it is possible that the rise in hazard rates actually reflect an artifactual “edge effect” from the 90 day lag, compounding the rise of Omicron with the residual volatility of Delta. While it makes sense to remove new reinfections from the eligible population, the 90-day window likely has to be shortened as well to accomodate Omicron’s quicker appearance. Reducing the window of observation would likely mitigate (at least somewhat) the rise in reinfection hazard. If I were a peer-reviewer, I would ask the authors to produce a sensitivity analysis on the length of eligibility delay, in addition to the intermediate steps for this hazard analysis (Approach 2).
Criticism 3: Modeling Probability of Detection as Time-Invariant
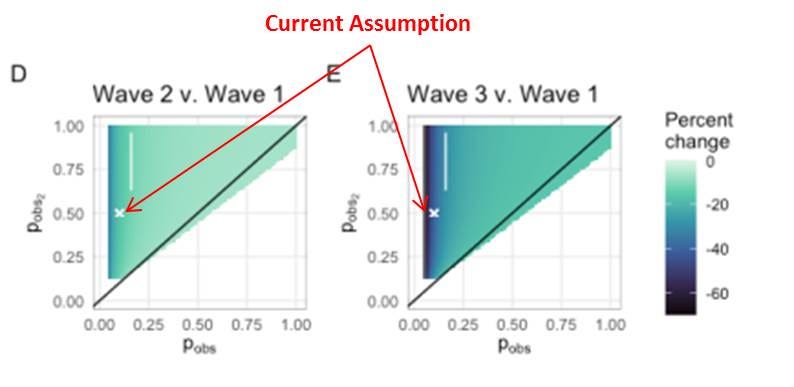
As suggested above, the authors model a probability of diagnosing an infection or reinfection adds an arbitrary factor to the analysis, that can influence the effect. Here, the authors suggest that only 10% of primary infections and 50% of reinfections are diagnosed. These assumptions come from seroprevalence data from two other studies, one from S. Africa and another studying U.K. healthcare workers (SIREN). The authors do provide a sensitivity analysis for this probability, and state that the “conclusions are robust to these assumptions.” Even so, the sensitivity analysis does show that there could be up to 60% change in the relative empirical hazard ratio (relative to Wave 1), due to changes in probability (particularly for primary infection).
More problematic, however, is the author's’ assumption that these observational probabilities are static — that is not varying with time. However, this is a critically tenuous assumption — particularly with the ramp-up of testing generally, and the introduction of antigen testing specifically (see above). One would expect that these observational probabilities would generally increase with time. The authors note “civil unrest” in two S.African geographies, which may focally decrease observational probabilities. Regardless, the observational probabilities are likely very different in Wave 1, compared to Wave 3 and Wave 4 (Omicron).
This is another a critical concern, as their top line conclusion of a 2.39x increase in reinfection risk is compared to Wave 1, obviously with very different observational probabilities. The authors should give a clear explanation on why they the observational probabilities are not time-varying, and whether this would challenge their conclusion.
Criticism 4: The Role of Civil Unrest Between Versions 1 and Versions 2
One interesting limitation that the authors bring up in Version 2, was the civil unrest in highly populous areas during July, around the time of the Delta wave peak. The authors state, that this could lead to misclassification of individuals regarding status,.
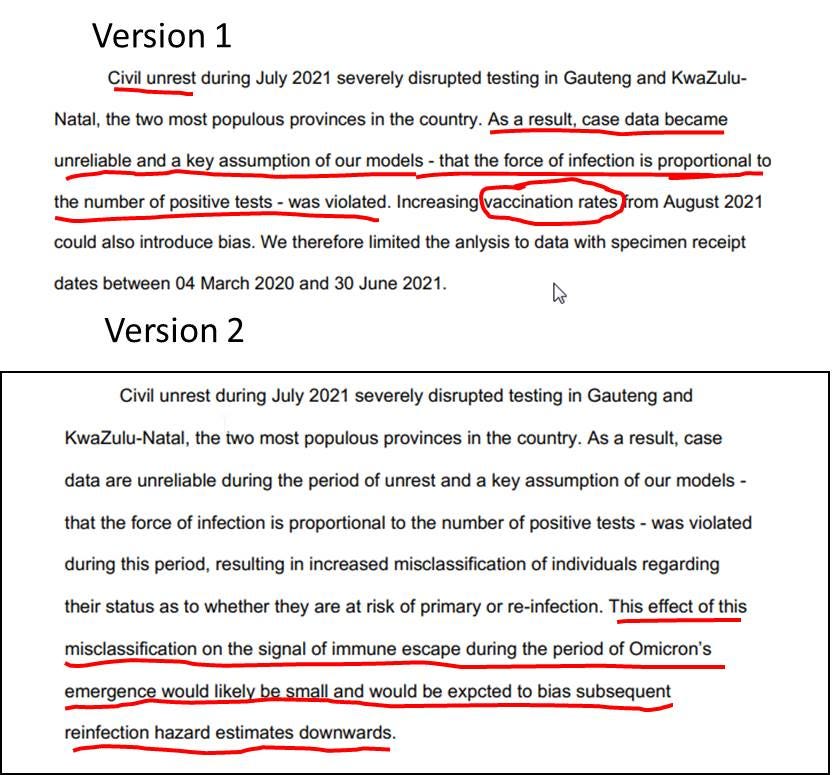
However, in the prior Version 1, the suspected impact of this civil unrest was sufficient to truncate it completely from the analysis. For Version 2, the authors do include it and admit that it was still “unreliable”, but note that the bias would be small. As I have shown above, the model presented in this study is “causal” — current results depend on past circumstances — and therefore, alter current values. Given the author’s original trepidation to include the results, they should provide a more thorough analysis of the potential biases introduced by the civil unrest.
Likewise, in Version 1 they excluded data after June due to the rise of vaccination and the time-confounding of results. However, in Version 2, they mostly discount the force of vaccination (except for a crude sensitivity analysis). Correctly, however, in the manuscript, they acknowledge this limitation of the study.
Conclusions
Most studies of primary infection and reinfection, are designed in a way that compares cohorts (vaccinated vs. unvaccinated vs. previously infected) at a particular instance in time (3 months, 6 months etc.). This study is relatively unique it its attempt to compare the current period (Omicron) to prior periods (Beta, Delta), and make relative conclusions. This fundamentally, assumes that circumstances stay similar over time — but as with anything COVID, that is hardly the case. The time-varying confounders (testing and vaccinations), methodological idiosyncracies, and geopolitical disturbances, challenge the validity authors’ conclusions.
To summarize there are at least several key criticisms that the authors should address, that will hopefully be raised in peer-review:
The late introduction of rapid antigen testing to the national database, which likely differ with time, and change testing circumstances (access, method, reasons for testing). The authors need to provide a specific accounting for rapid antigen testing (and overall testing capacity at large) as a function of time.
For “Approach 2”, the use of a 90-day “grace period” for reinfection eligibility, when the Omicron wave appears to arise much sooner than 90 days, has the potential to create artifact and unexpected correlation in hazard estimates. The authors should address by running a sensitivity analysis on “grace period” length, and provide absolute primary infection and reinfection numbers during the time of concern.
The use of observational probabilities to model undiagnosed infections adds an arbitrary factor that alter the conclusion. Moreover, the assumption that these probabilities are time-invariant is likely flawed, and particularly ill-posed for a study that makes comparisons over time. The authors should address through a separate analysis excluding these probability terms (or assume it equals 100% for the base case), and then test sensitivities downward.
Geopolitical events, such as civil unrest, may cause focal disturbances in key assumption. Though the suspected bias is presumed to be small, a full sensitivity analysis should be conducted.
Generally, the authors should provide more descriptive data, such as the absolute numbers of infections/reinfections during the time of Omicron, demographics/geographies of infected/reinfected persons, control for time “at-risk”, details on statistical adjustments, etc.
As such, the conclusions of this study, particularly describing Omicron, should be moderated until more data is available and more conventional study designs can be implemented. Many public pundits are pointing to this study to compel vaccination in the previously infected — because natural immunity may not be “protective”. However, this study has absolutely nothing to do with proving the value of vaccination in the previously infected population. As the authors suggest, a more “nuanced” approach that incorporates vaccination history if required to inform public health policy.
And, this critique does not exclude the possibility of higher reinfection risk with Omicron. In fact, it is probably likely to some degree — although the magnitude of reinfection risk and its comparison to primary infection and vaccinated breakthrough need to be thoroughly studied. This will simply take more data over time. We need to be scientists, not alarmists.
Again, I do commend and thank the authors for bravely putting out a timely piece of work, with global implications. It raises the suspicion of possible immune escape with Omicron, and rightfully asks for further “nuanced” investigation. Unfortunately, as is the case these days, media outlets amplify top line results to stoke fear and gain readership, but fail to provide any critical appraisal that is required in true scientific discourse. This article fills that critical, yet constructive, role. As stated earlier, I have reached out to the authors of this study regarding some of the above queries— and I will provide any updates if I hear back from them.
Thank you for reading!
[DISCLAIMER: This article represents my opinion only, and not of any organization I am affiliated with. It based upon best efforts to compile and analyze the data and evidence. The intended use is for policy and public discussion purposes only. It is not a substitute for advice from a personal physician. Please consult your personal physician for health advice.]